


Bitcoin has fallen to around $67,200 on Nov. 14, losing more than 10% so far this week and slipping beneath its 200-week moving average as selling continues below $70,000.
Summary
- Bitcoin traded below its 200-week moving average near $67,992, with the weekly candle still open.
- Daily RSI fell to 22.96, while price dropped beneath the lower Bollinger Band.
- U.S. Bitcoin ETFs lost roughly $1.44 billion across five trading sessions through Nov. 11.
- Merlijn The Trader said he would bid at $66,000 after Bitcoin lost $70,000.
TradingView’s Binance BTC/USDT charts show Bitcoin touching $66,456 before recovering toward $67,194 in the Nov. 14 snapshot. The daily candle was down 1.64%, while the weekly chart showed a 10.24% decline from an opening price near $74,851.
Bitcoin trades below its 200-week moving average
On the weekly chart, Bitcoin’s 200-week simple moving average stood at $67,992, leaving price approximately 1.2% beneath the line. The candle had not closed, so the snapshot shows an intraweek break below the average, with confirmation dependent on where the week finishes.
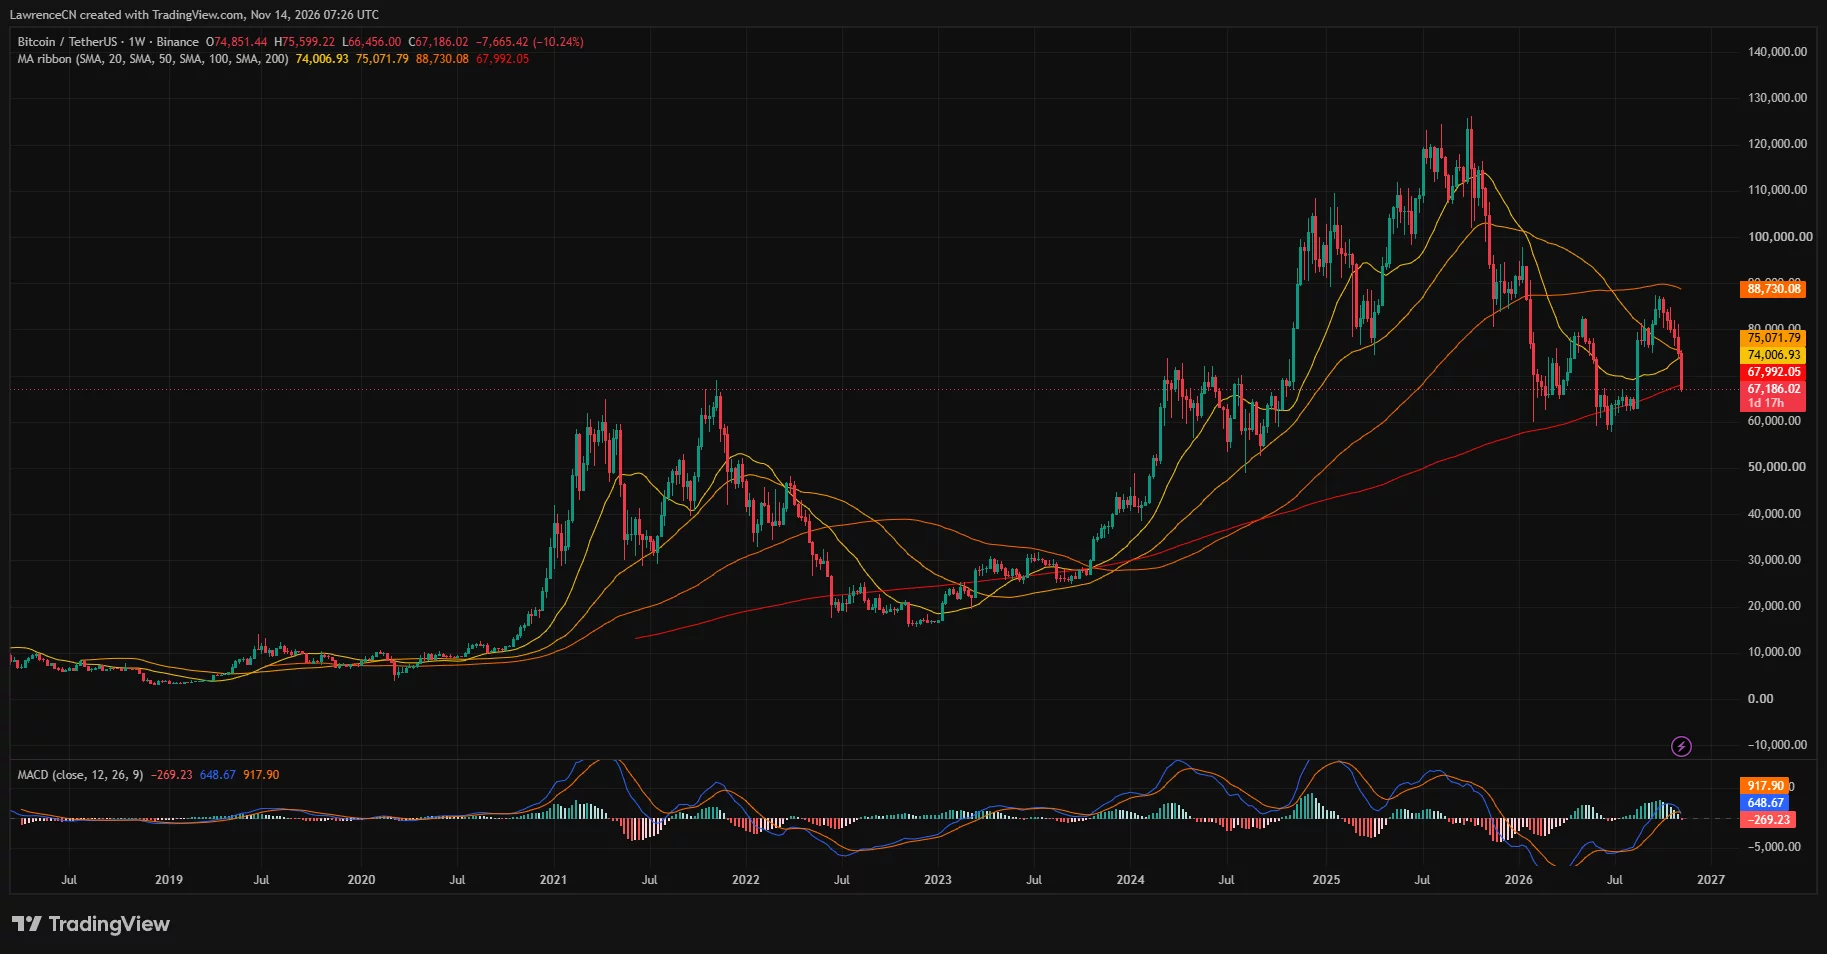
The 20-week and 50-week averages sat much higher, at $74,007 and $75,072. Both now lie above price, alongside the 100-week average at $88,730.
Weekly momentum has weakened alongside the decline. The moving average convergence divergence indicator showed its MACD line at 648.67, below the signal line at 917.90, with a negative histogram of 269.23 points.
Although both lines remained above zero, the crossover showed the latest recovery losing momentum. Earlier weekly candles show a previous trading area around $60,000–$63,000 beneath the current low, providing a historical reference if the decline continues.
In a Nov. 14 X post, trader Merlijn The Trader emphasized the loss of the $73,000–$70,000 area and the importance of the weekly close. His post referenced a lost 200-day moving average, a different indicator from the 200-week line on the weekly chart.
“Most will sell the pain. I’ll be bidding it at $66K,” he wrote.
The weekly low was $730 beneath the price shown in the daily snapshot. Compared with the weekly opening level, the move to that low represented a decline of approximately 11.2%, calculated from the displayed Binance figures.
Daily RSI falls below 23 as selling accelerates
Bitcoin’s daily relative strength index stood at 22.96, below the conventional oversold threshold of 30. Its RSI average remained higher at 35.48.
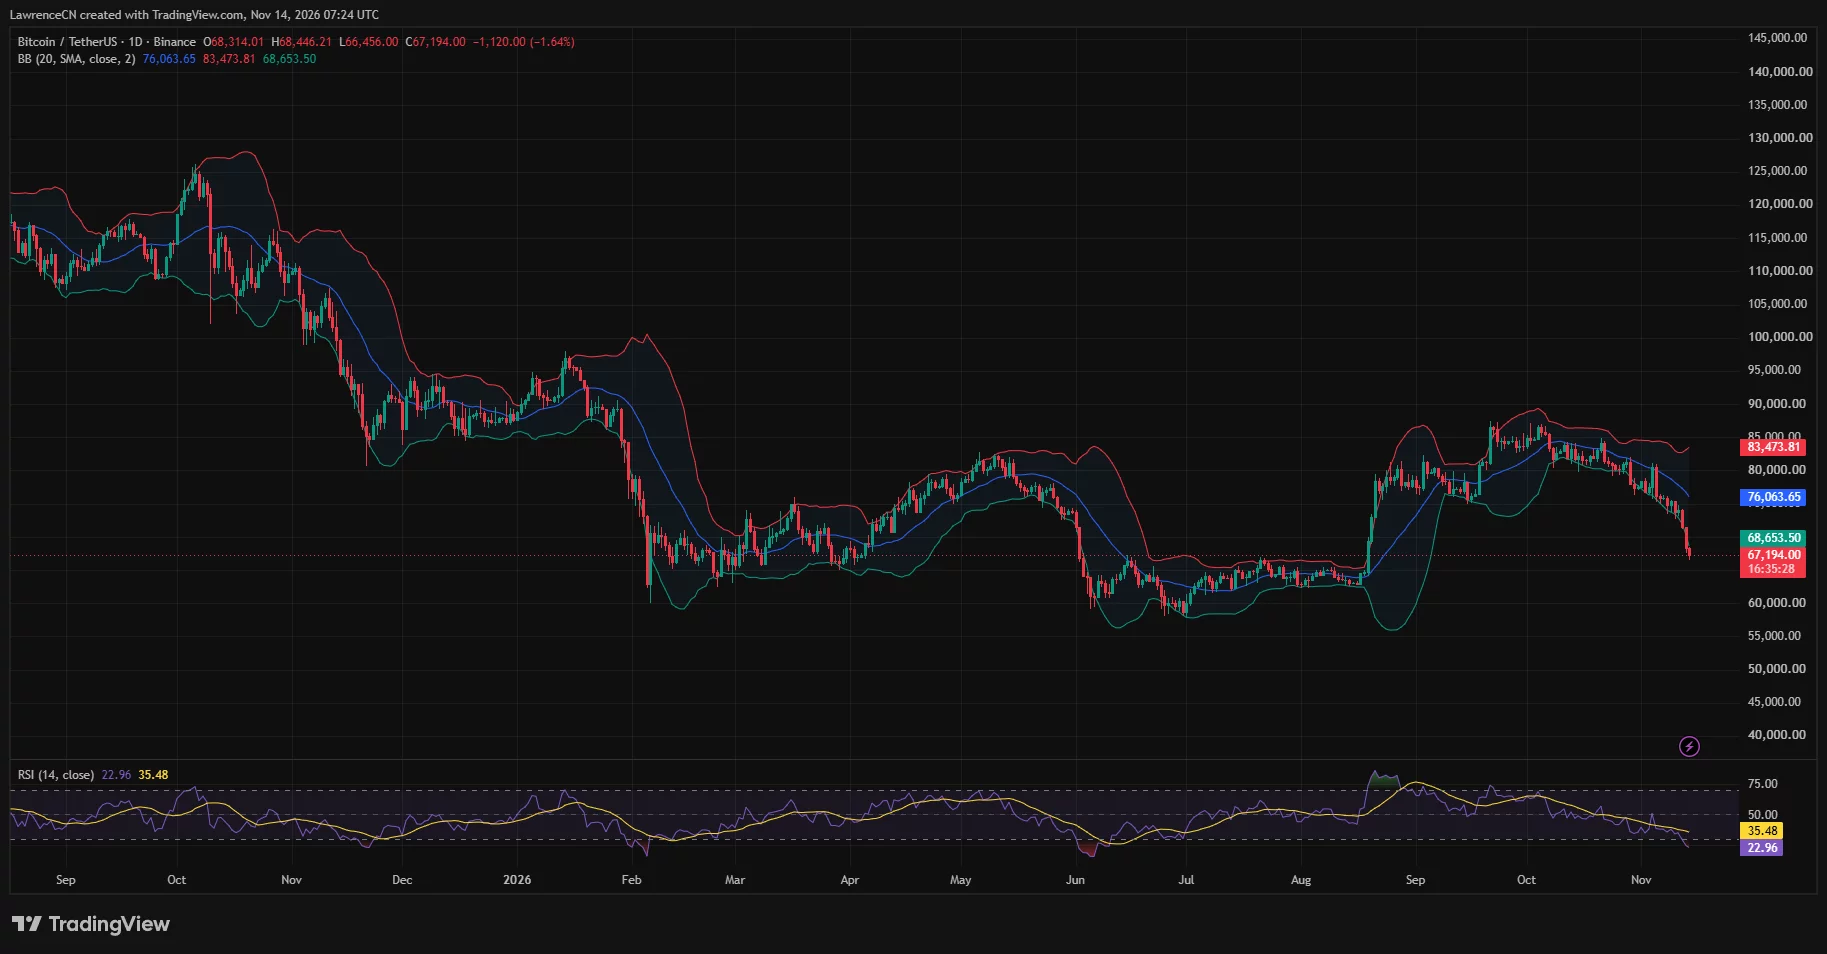
Price had fallen beneath the lower Bollinger Band at $68,654, while the 20-day midpoint stood at $76,064 and the upper band at $83,474. The widening bands accompanied the latest large red candles.
An oversold reading can accompany a rebound, but it does not establish that selling has finished. On this chart, Bitcoin had neither recovered the lower band nor returned above $70,000.
The lower band and 200-week average create nearby recovery references around $68,000–$68,650. Higher up, the weekly averages near $74,000–$75,100 sit close to the daily Bollinger midpoint, concentrating several technical levels within the same overhead area.
ETF withdrawals persist despite brief inflation relief
The decline follows another round of institutional withdrawals. As crypto.news previously reported, U.S. spot Bitcoin ETFs recorded five days of withdrawals totaling approximately $1.44 billion through Nov. 11, according to SoSoValue.
BlackRock’s IBIT accounted for $269.73 million of the $299.9 million withdrawn that day. Cumulative net inflows since the funds’ January 2024 launch nevertheless remained positive at $55.1 billion.
Derivatives traders faced heavy losses during the preceding selloff. CoinGlass figures cited in Nov. 13 coverage put leveraged crypto liquidations at $1.47 billion over 24 hours, including $1.31 billion in longs, equivalent to roughly 89% of the total.
October consumer inflation rose 0.4%, exceeding the 0.3% forecast. Friday’s producer inflation release offered some relief: monthly PPI rose 0.3%, below expectations of 0.4%. Bitcoin briefly recovered toward $70,000 after that release, before the Saturday chart showed renewed losses.
Liquidity had already weakened before the latest drop. In a Nov. 10 assessment, Bitget Wallet analysts tied a durable recovery to sustained positive ETF flows and stronger spot demand. DefiLlama figures cited alongside that assessment put stablecoin capitalization at $289.81 billion, down 4.57% over 30 days. The analysts had identified a break below $73,000 as a route toward $68,000.
Liquidation clusters remain above Bitcoin’s price
CoinGlass’s one-month heatmap shows successive declines through $80,000, $75,000 and $70,000, with the latest candles approaching $67,000.
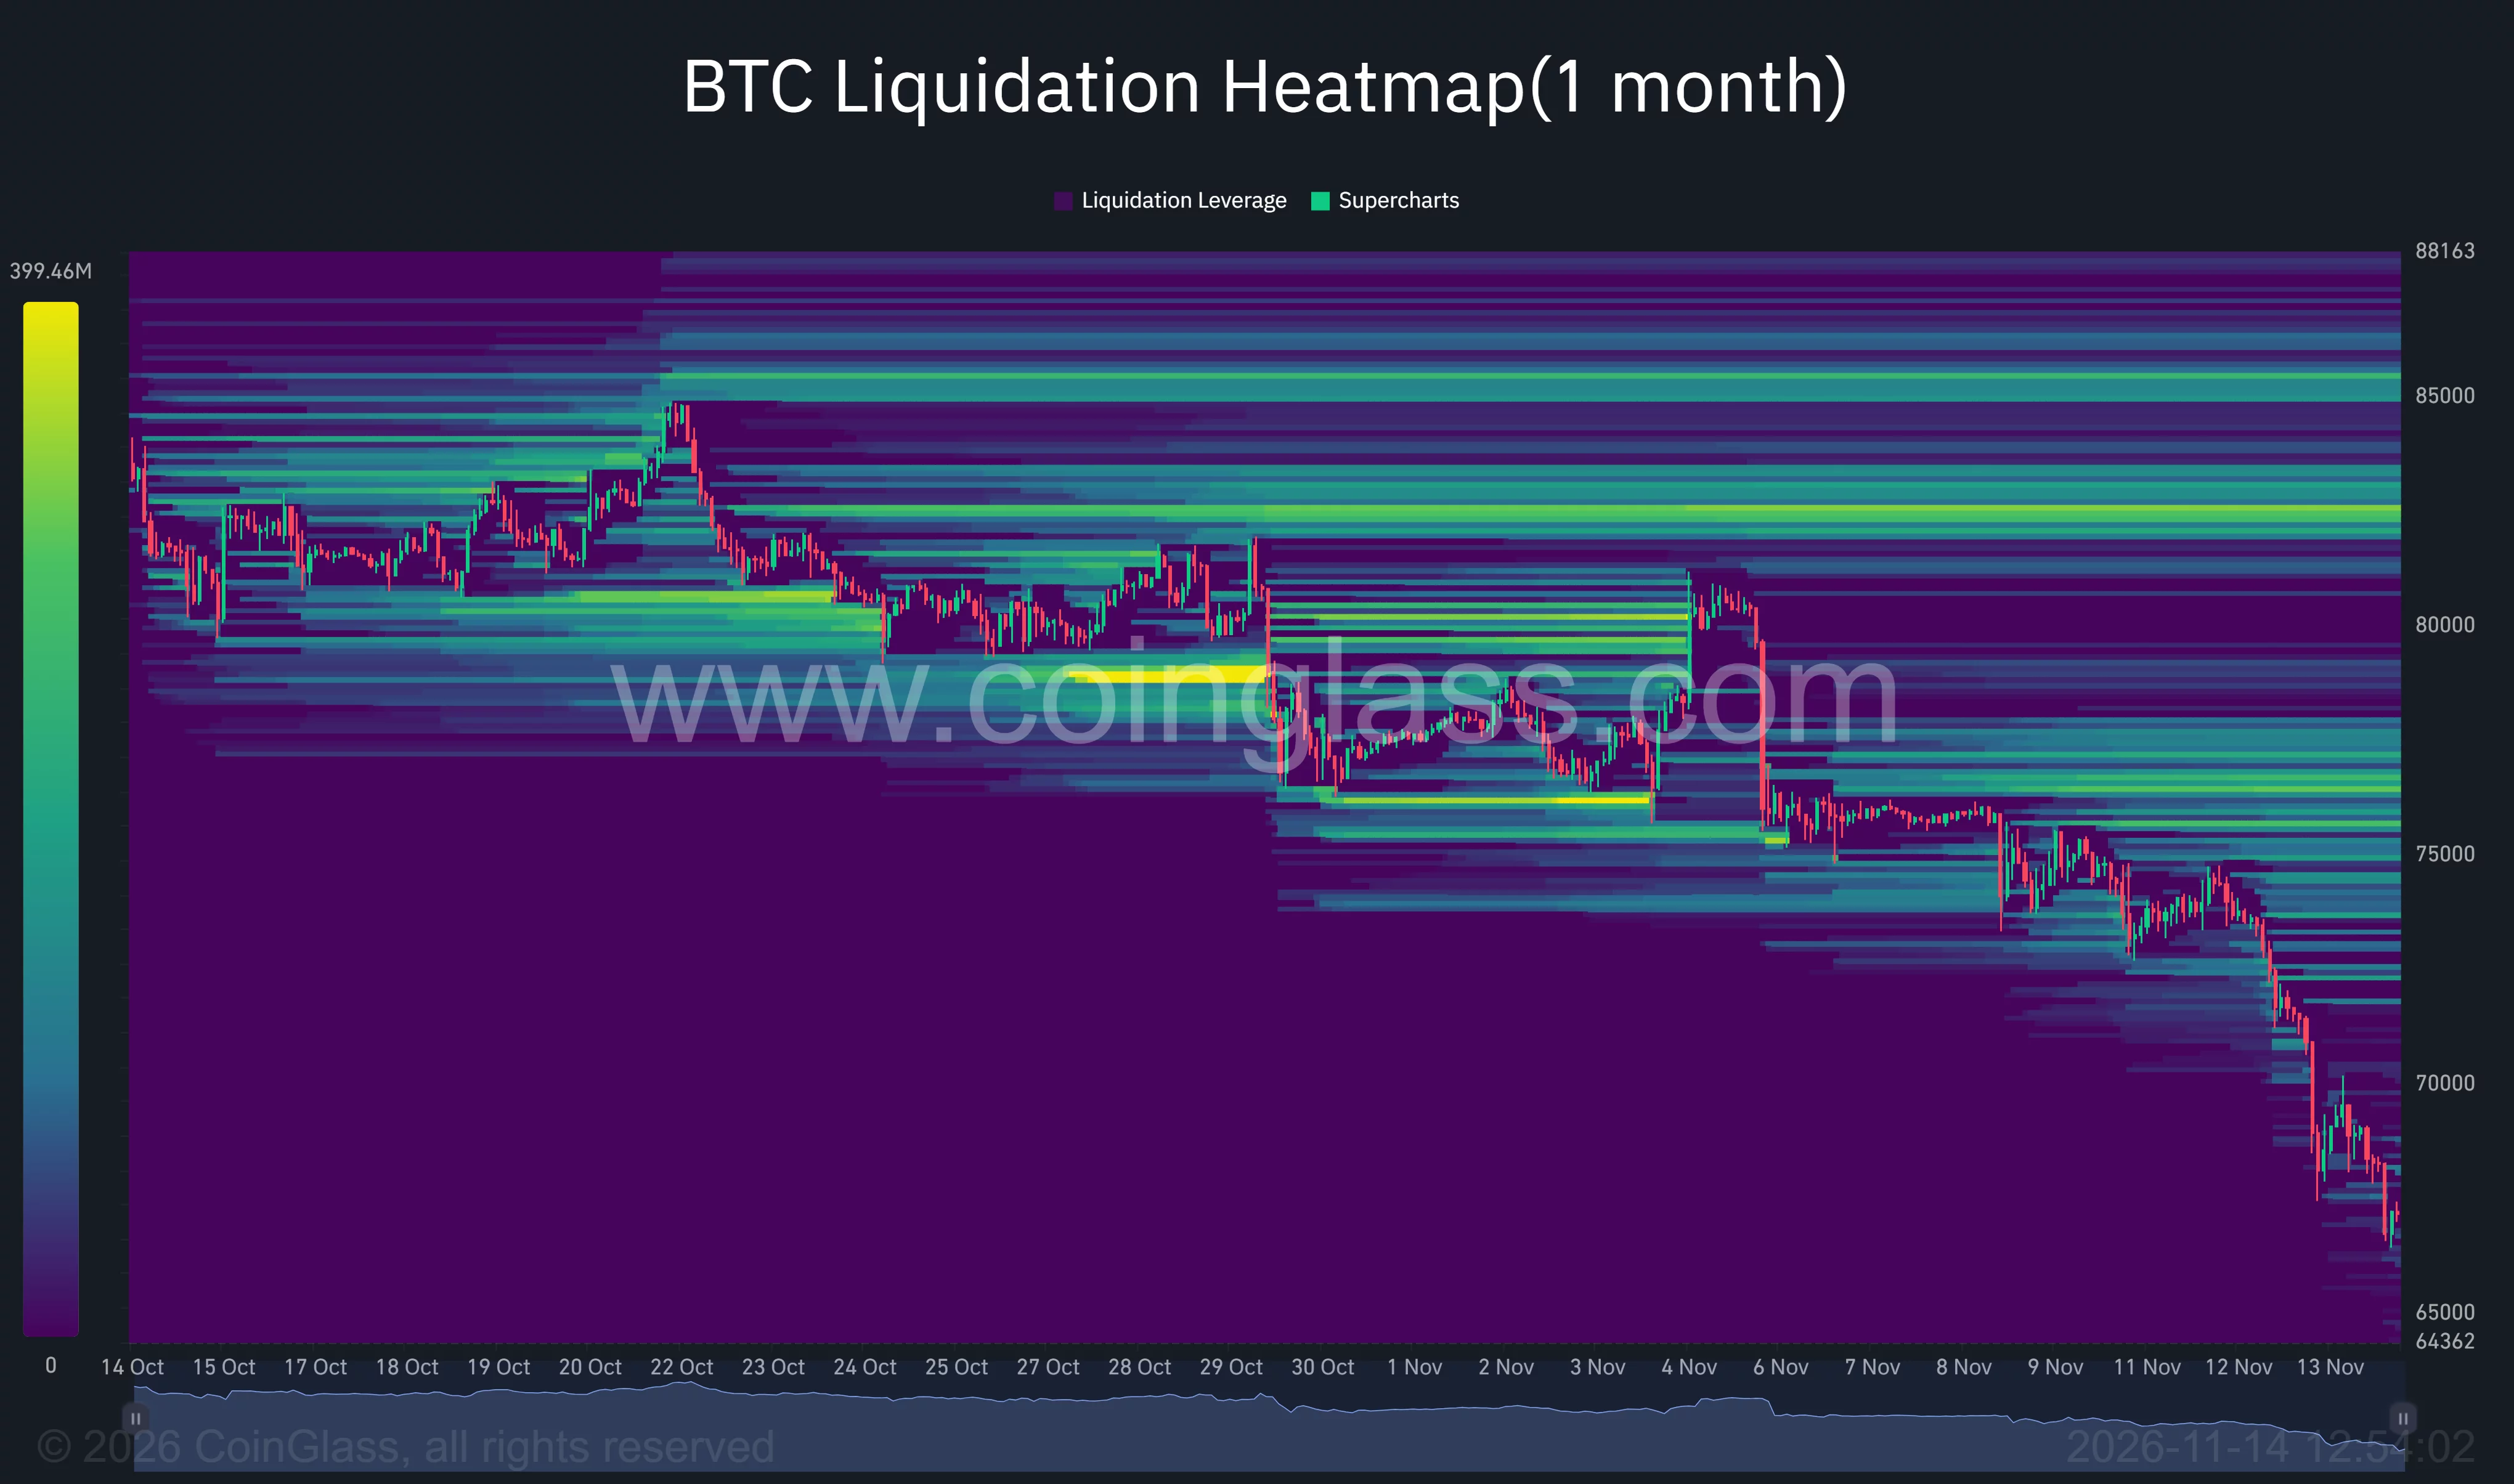
At the right edge, visible liquidation concentrations remain around $72,000–$73,000 and $75,000–$78,000, with larger bands farther above near $82,000–$83,000. These represent estimated liquidation exposure, not confirmed buy orders or guaranteed price targets.
The chart’s displayed range ends near $64,362, limiting the information it provides about leveraged positions beneath that price.
Disclosure: This article does not represent investment advice. The content and materials featured on this page are for educational purposes only.
