

Bitcoin price slipped back below $80,000 after reaching a multi-month high above $81,200, as overbought conditions and resistance near its previous range high prompted traders to take profits.
Summary
- Bitcoin price retreated toward $79,250 after its advance stalled above $81,200.
- The daily RSI reached 82.44, placing BTC deep inside overbought territory.
- Strong 4-hour trend readings show that the wider breakout structure remains intact.
- Liquidation data places key liquidity clusters near $78,000 and between $81,000 and $82,000.
Bitcoin price cools after testing $81,200
According to data from crypto.news, Bitcoin (BTC) price traded near $79,250 on Aug. 25 after briefly reaching approximately $81,250. The pullback placed BTC about 2.5% below its intraday peak while leaving it well above the levels recorded before last week’s breakout.
The decline followed a rally of about 25% from the $63,000–$65,000 region. Bitcoin moved through $70,000, $72,000, and $78,000 within several sessions before meeting heavier selling pressure above $80,000.
A weaker dollar and renewed concerns about currency debasement supported the advance. Demand from U.S. spot Bitcoin exchange-traded funds also contributed to the move.
Data from SoSoValue showed that U.S. spot Bitcoin ETFs attracted $337.56 million in net inflows on Aug. 24. BlackRock’s IBIT led with $208.9 million, while Fidelity’s FBTC received $104.6 million.
The next completed ETF flow reading could show whether U.S. investors used the retreat as an entry point or reduced their exposure after BTC failed to hold above $80,000.
Overbought RSI raises the risk of a deeper pullback
Bitcoin’s daily relative strength index rose to 82.44, well above the 70 level commonly used to identify overbought conditions. Its RSI moving average stood at 63.87.
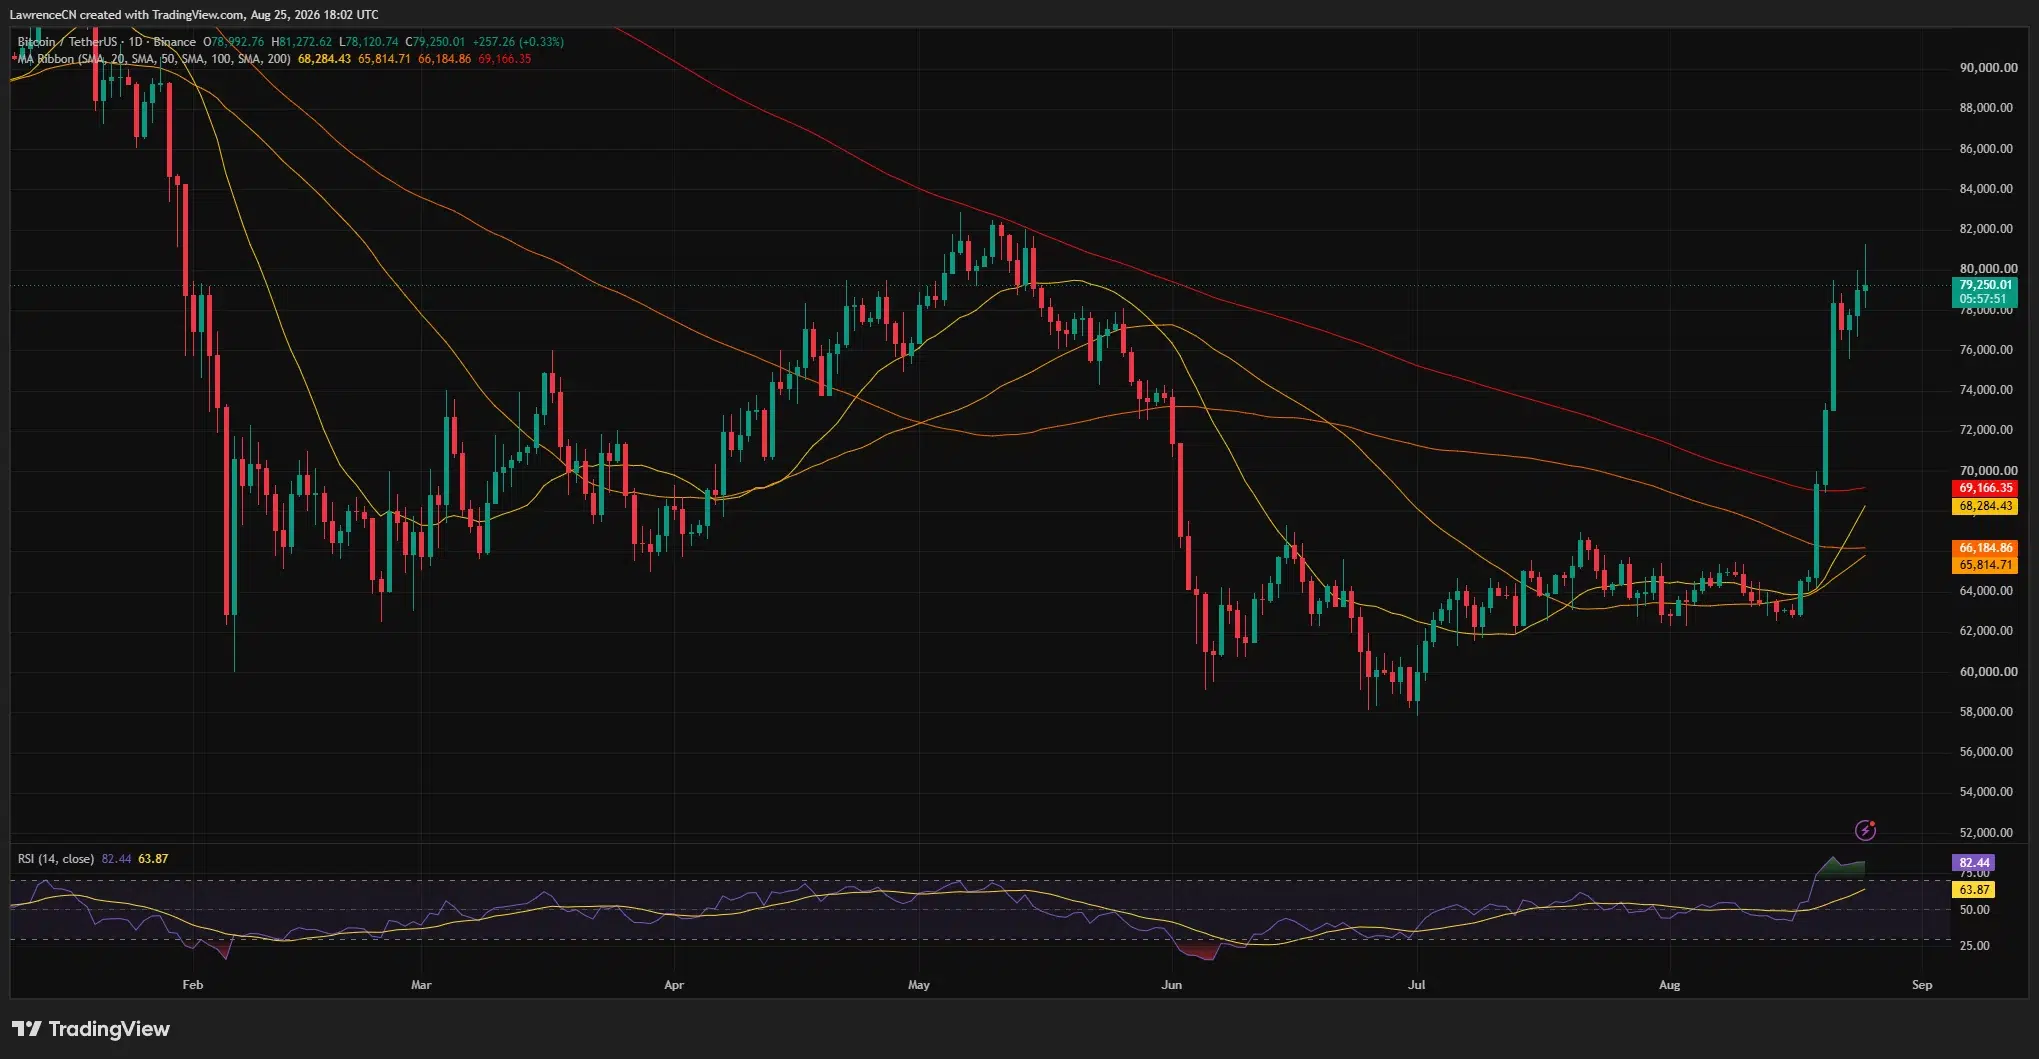
An overbought RSI does not confirm that a rally has ended, but it shows that price has risen rapidly relative to its recent trading history. The reading increases the risk of consolidation or a pullback as early buyers lock in gains.
BTC nevertheless remains above every major moving average displayed on the daily chart. The 20-day simple moving average stands at $68,284, followed by the 200-day SMA at $69,166. The 50-day and 100-day averages sit lower at $65,815 and $66,185, respectively.
Bitcoin’s move above the 200-day SMA marked an important change from the structure that controlled trading between June and mid-August. BTC had remained below that long-term average during its consolidation around $58,000–$66,000.
The 4-hour chart also shows that the wider move retains considerable strength. The average directional index stood at 56.52, far above the 25 threshold generally associated with an established trend.
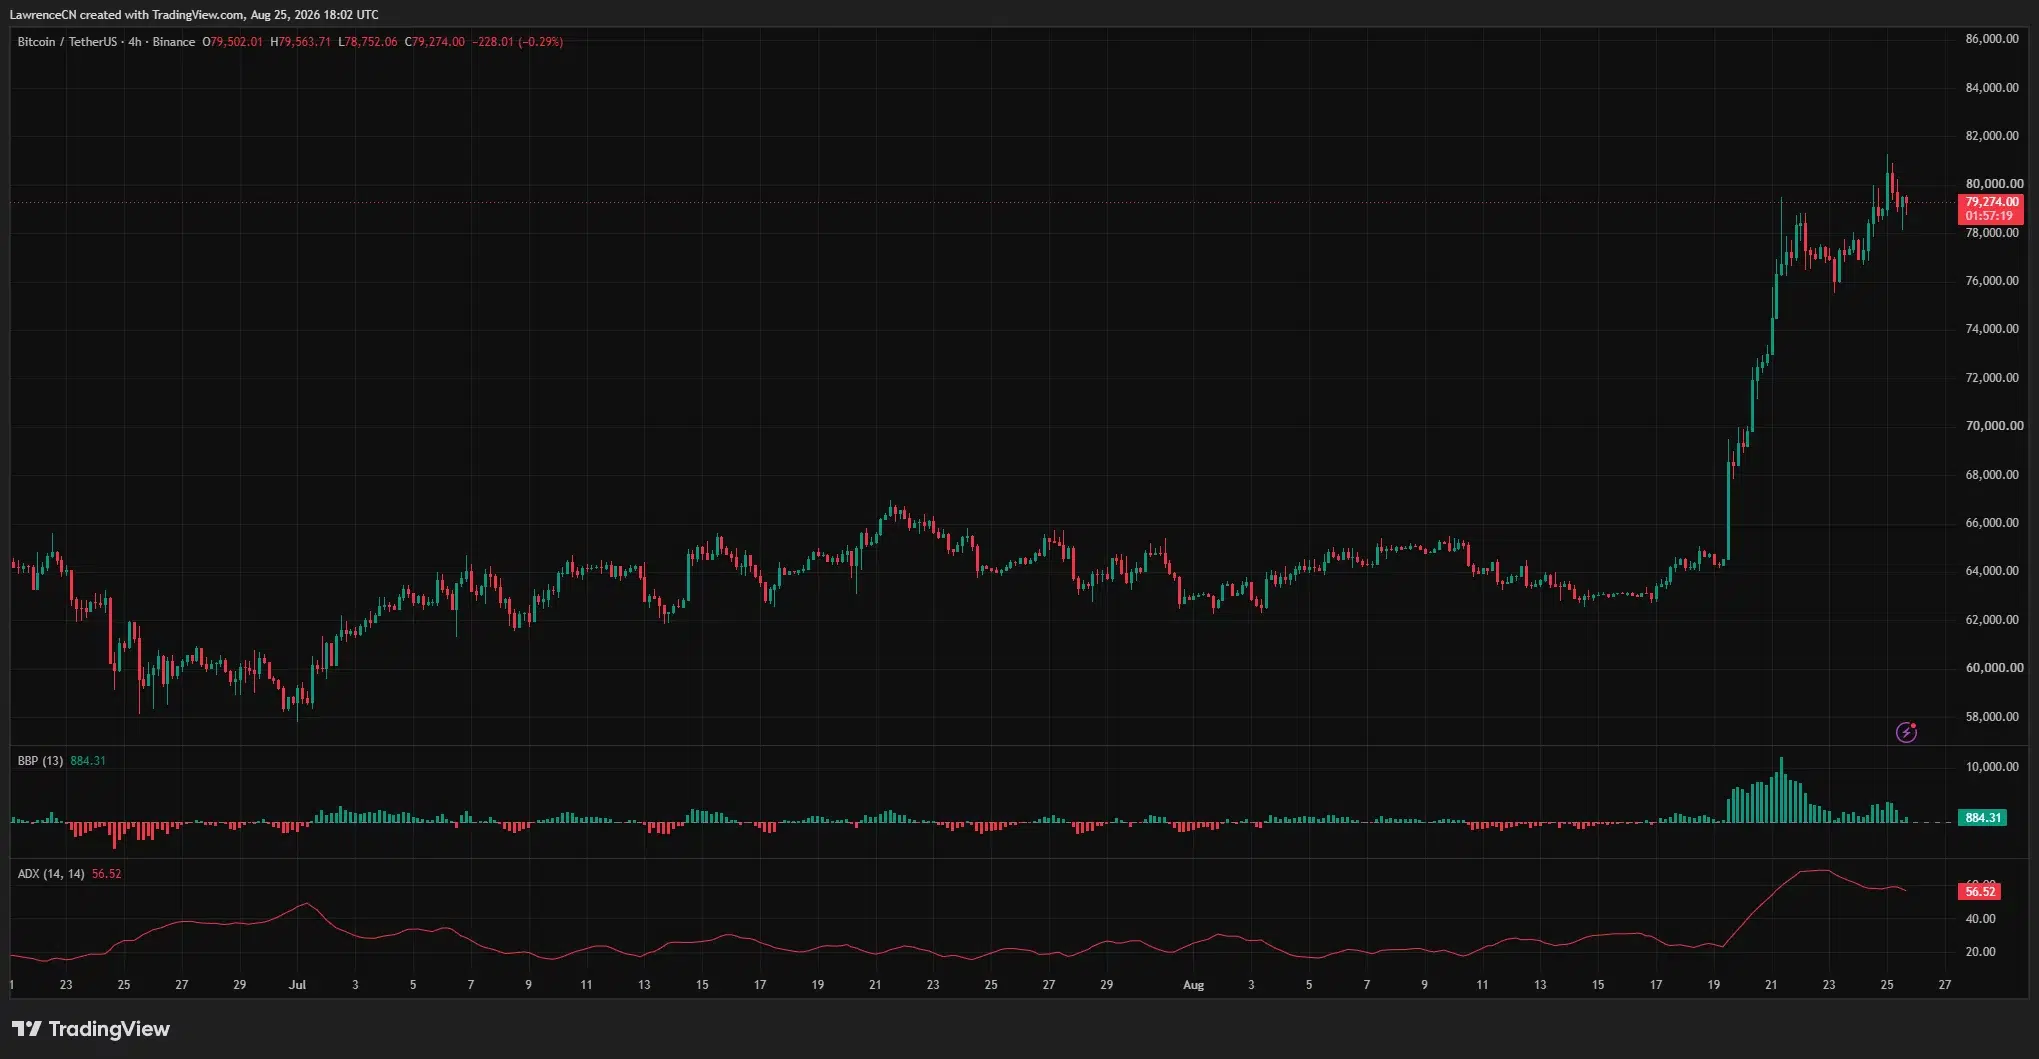
However, the ADX has started easing after reaching a higher reading during the initial breakout. Bull Bear Power remained positive at 884 but had fallen sharply from the levels recorded during the strongest part of the rally. Both readings suggest that upward momentum remains present but is no longer accelerating at the same rate.
Ted Pillows said in an Aug. 25 X post that Bitcoin had developed a bearish divergence on the 4-hour chart. The analyst identified $72,000–$74,000 as a possible correction area following the sharp rally.
A bearish divergence appears when price records a higher high while a momentum indicator produces a lower high. It can warn that buying pressure is weakening, though the pattern requires confirmation through a loss of support.
Liquidation heatmap places $78,000 in focus
The 24-hour CoinGlass liquidation heatmap shows one of the clearest nearby liquidity concentrations around $78,000. Bitcoin briefly approached that area during the session before recovering toward $79,000.
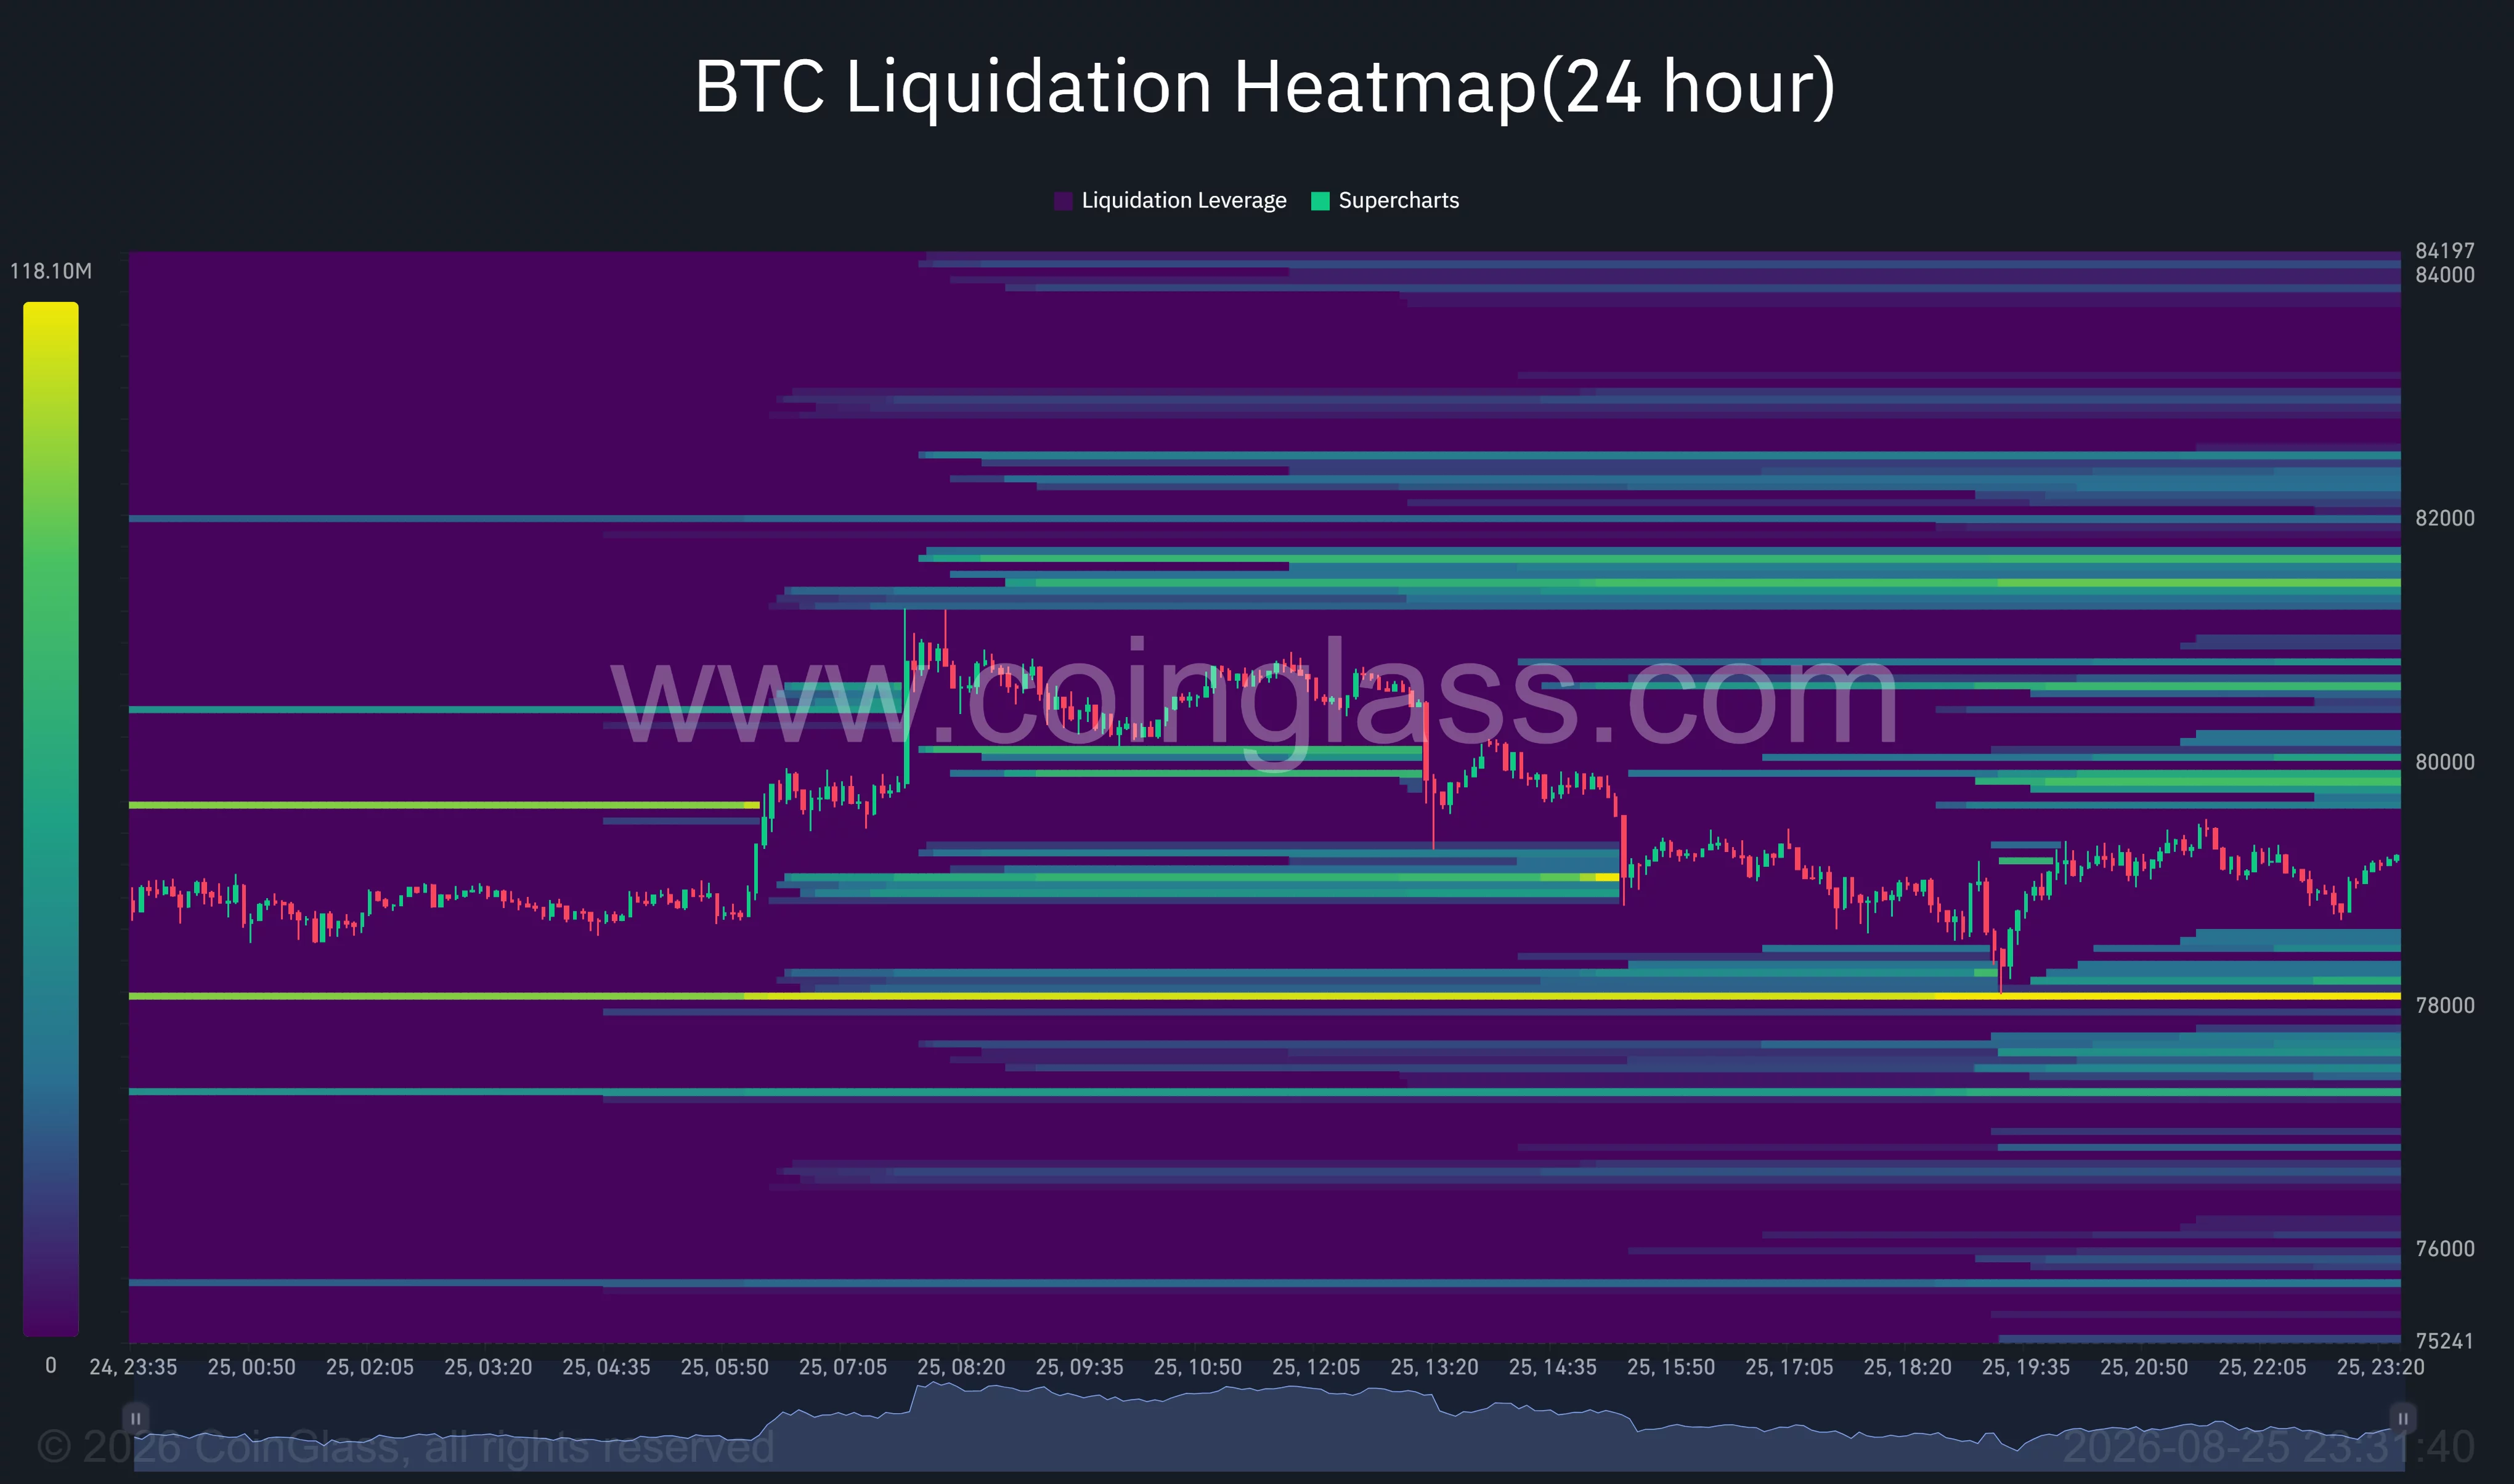
A stronger move below $78,000 could draw price toward additional liquidity around $77,200–$77,500. The chart also shows lower clusters around $75,500–$76,000, although those levels would require a much larger correction.
Liquidity is also stacked above the market. The strongest nearby upside concentrations appear from approximately $79,700 to $80,100 and around $80,500. Larger clusters sit between $81,000 and $81,700, followed by another band near $82,200–$82,500.
Liquidation heatmaps identify areas where leveraged positions may face forced closure, but they do not predict which cluster price will reach first. Bitcoin’s position between liquidity on both sides leaves it vulnerable to sharp intraday swings.
The broader derivatives readings do not yet show a fresh liquidation event accompanying the retreat. The latest supplied breakout-window estimate placed market-wide liquidations at $179.2 million, including $100.2 million in shorts and $79 million in longs.
Bitcoin futures open interest declined about 1.9% to $56.31 billion from $57.38 billion, based on CoinGlass data. Falling price alongside declining open interest suggests that some traders closed positions rather than aggressively opening new short exposure.
The reported $140 billion figure refers to wider crypto-market open interest, rather than Bitcoin futures alone, and should not be used interchangeably with the BTC-specific reading.
Bitcoin must reclaim $80,000 to resume the breakout
Daan Crypto Trades said on X that Bitcoin had reached the upper boundary of a wider range after holding support around $60,000. He placed the range high near $80,000 and noted that BTC had not fully tested the May high around $83,000.
For the bullish case, Bitcoin needs to reclaim the $79,200–$80,000 area and hold above it on a closing basis. A move through the intraday high near $81,250 would weaken the failed-breakout signal and place the May resistance region around $82,000–$83,000 back in view.
The first important downside zone sits between $77,500 and $78,000. A confirmed break below that area would expose $76,500–$77,000, followed by $75,700–$76,000.
A correction into those levels would still leave Bitcoin above its major daily moving averages. However, a drop toward $72,000–$74,000 would represent a deeper retracement and test the area identified by Pillows.
The broader breakout would face greater risk if BTC lost $72,500–$73,000, where the rally accelerated after clearing its earlier range. Until then, the retreat can remain a consolidation inside a strong trend, although the overbought daily RSI and weakening short-term momentum argue against treating another advance as confirmed.
Disclosure: This article does not represent investment advice. The content and materials featured on this page are for educational purposes only.
